Profiling memory usage
I’ve been using Stimmtausch 0.0.2 as my primary client for a bit now, having switched away from TinyFugue. I figure it’s stable enough (though there are some bugs), and hey, I worked on the dang thing…
Anyway, I was pretty happy about the memory usage I saw while developing, but during actual use I was…disappointed.
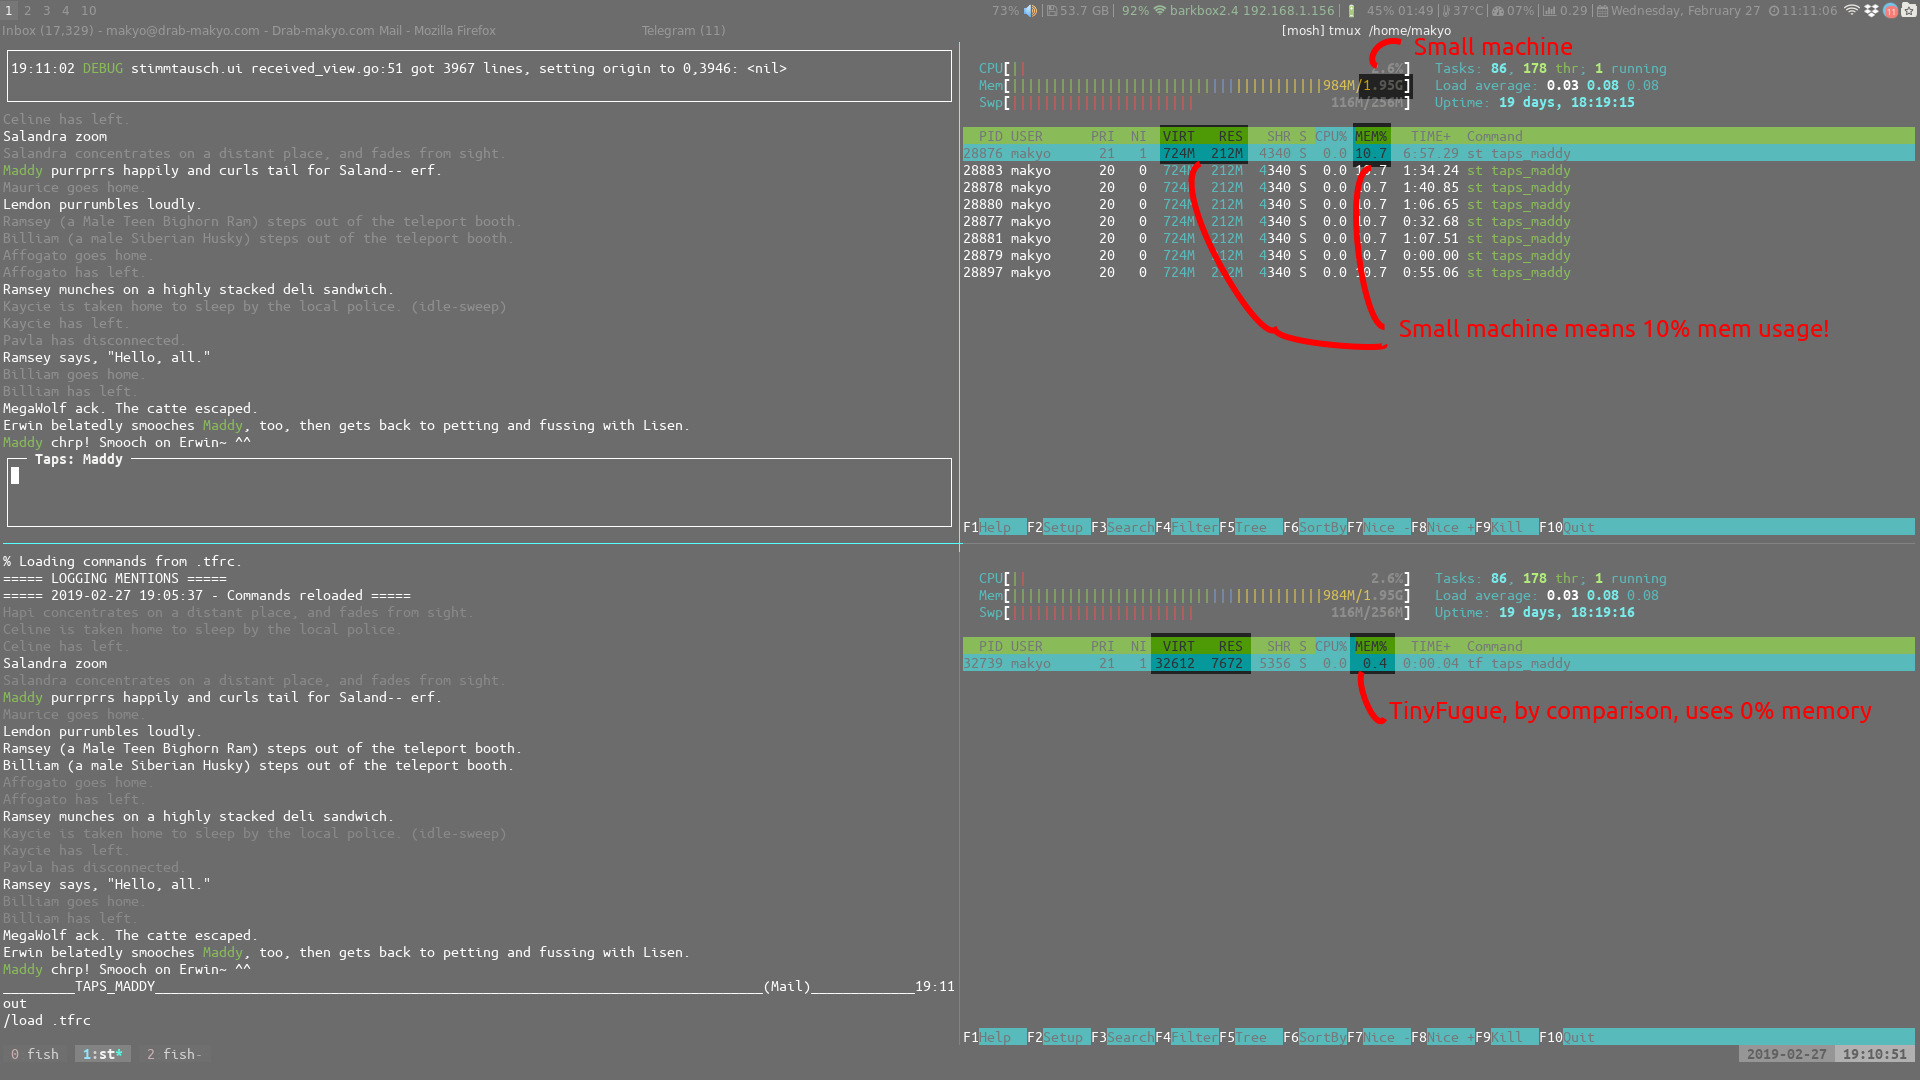
That’s…a lot of memory. Now, as noted, this is on a fairly small machine, with only 2GB of RAM. Still, that means that Stimmtausch is using 10% of it! What the hellll…
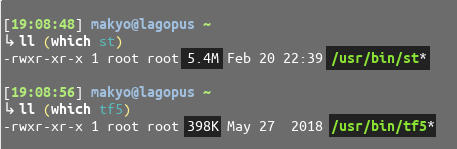
Now, it’s no surprise that Go programs can be big. Go eschews static dependencies for including everything it needs in the binary. This makes them eminently portable (and, indeed, one could simply download the binary of Stimmtausch and run it on basically any machine; all the installers do is drop the binary and global config files in the right locations), but also increases the size of the binary. TinyFugue, on the other hand, is written in C, which is much, much smaller. This also means that it should use a much smaller memory footprint, but not 100 times less memory, certainly.
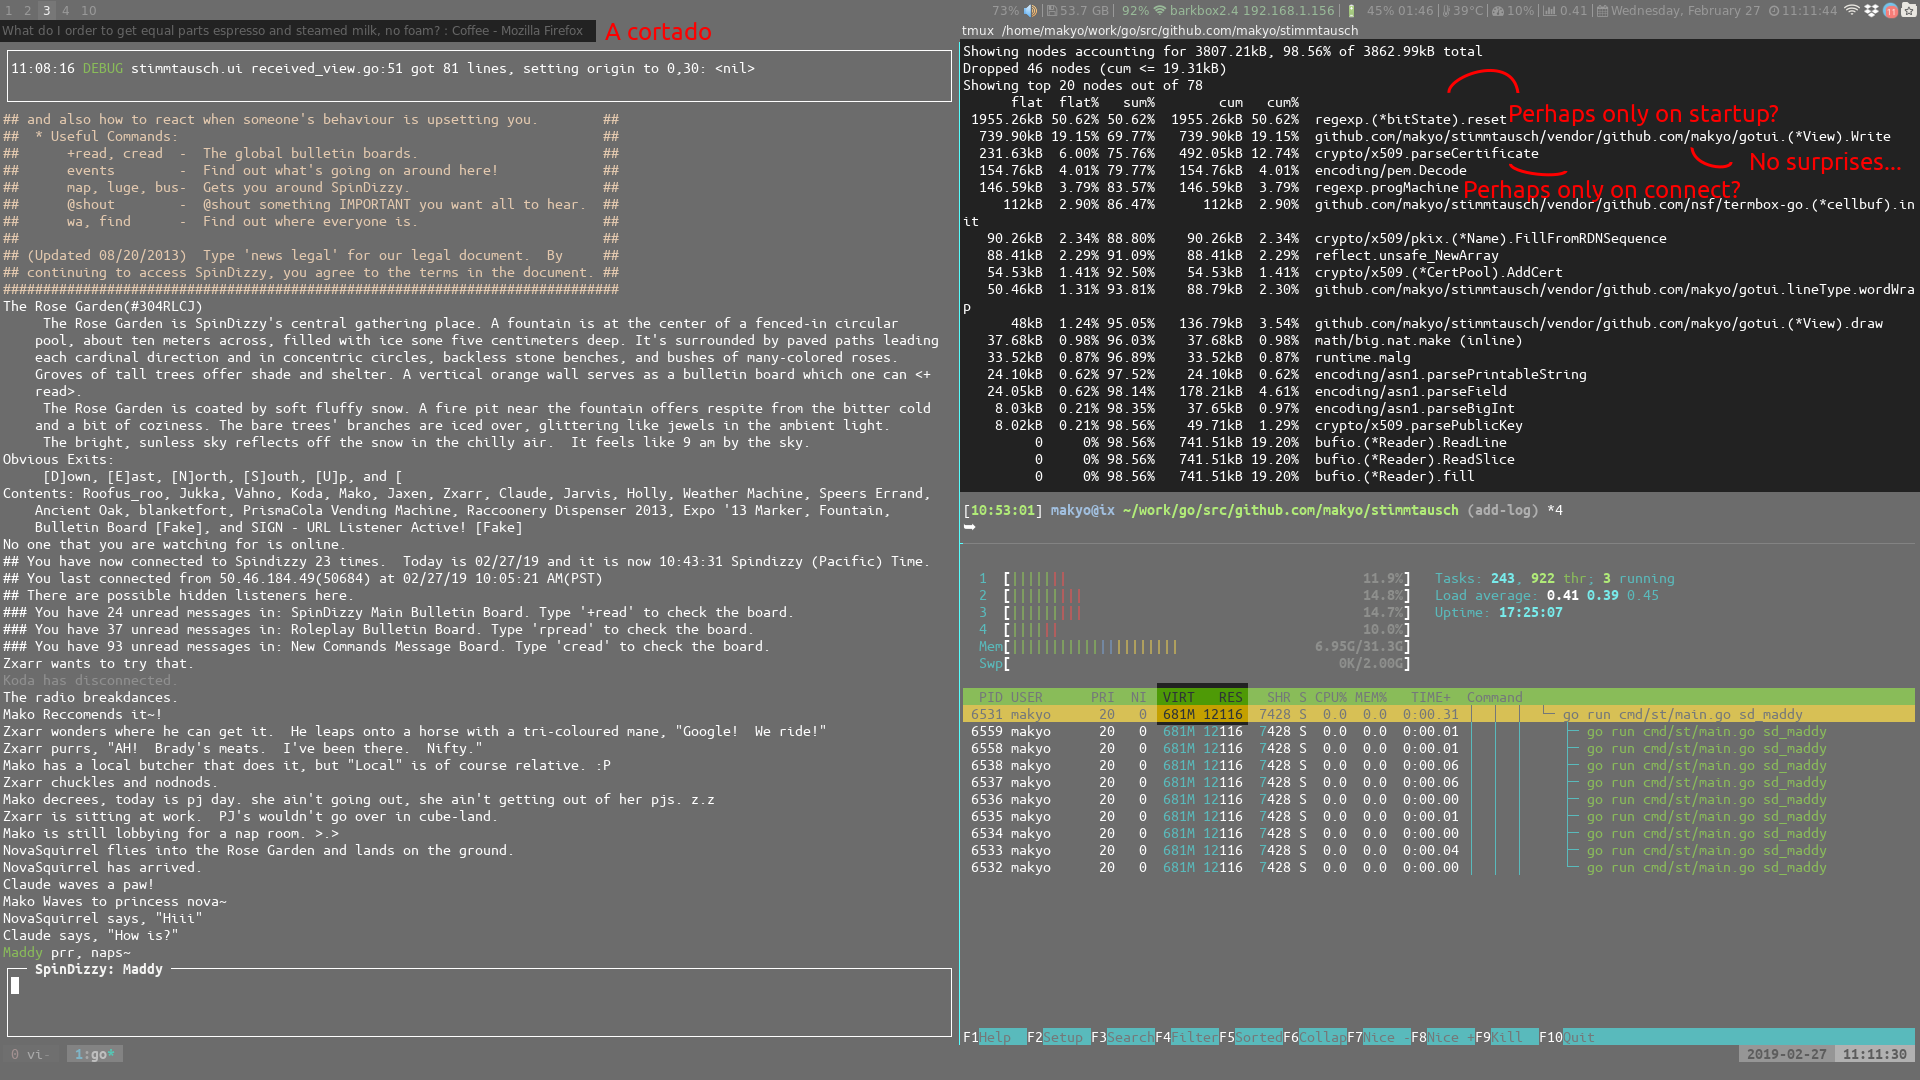
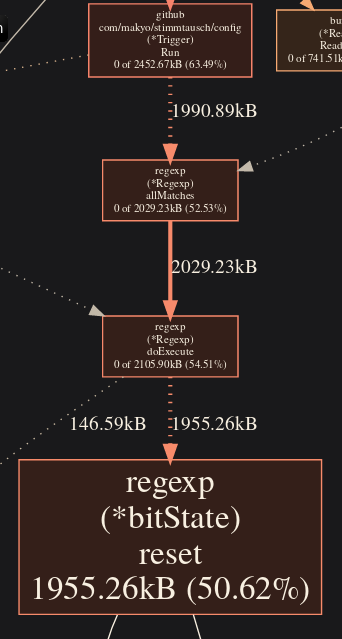
So I’ve been doing some digging. There are a few big culprits right away. Regular expressions are taking up quite a bit of memory. No real surprise, I suppose; even the TinyFugue authors warn of having too many triggers. Still, I’m learning this profiling tool, so I’ve got some questions about what’s actually going on behind the scenes. It could be that the numbers for regular expressions are counted once during compilation (where they take up a large amount of memory) and then left in there; that is, even though the regexp numbers are high in the profile, they could actually be using a very small amount of memory in reality. I don’t know when regexp.(*bitState).reset() occurs, after all. There’s a lot of data to sort through:
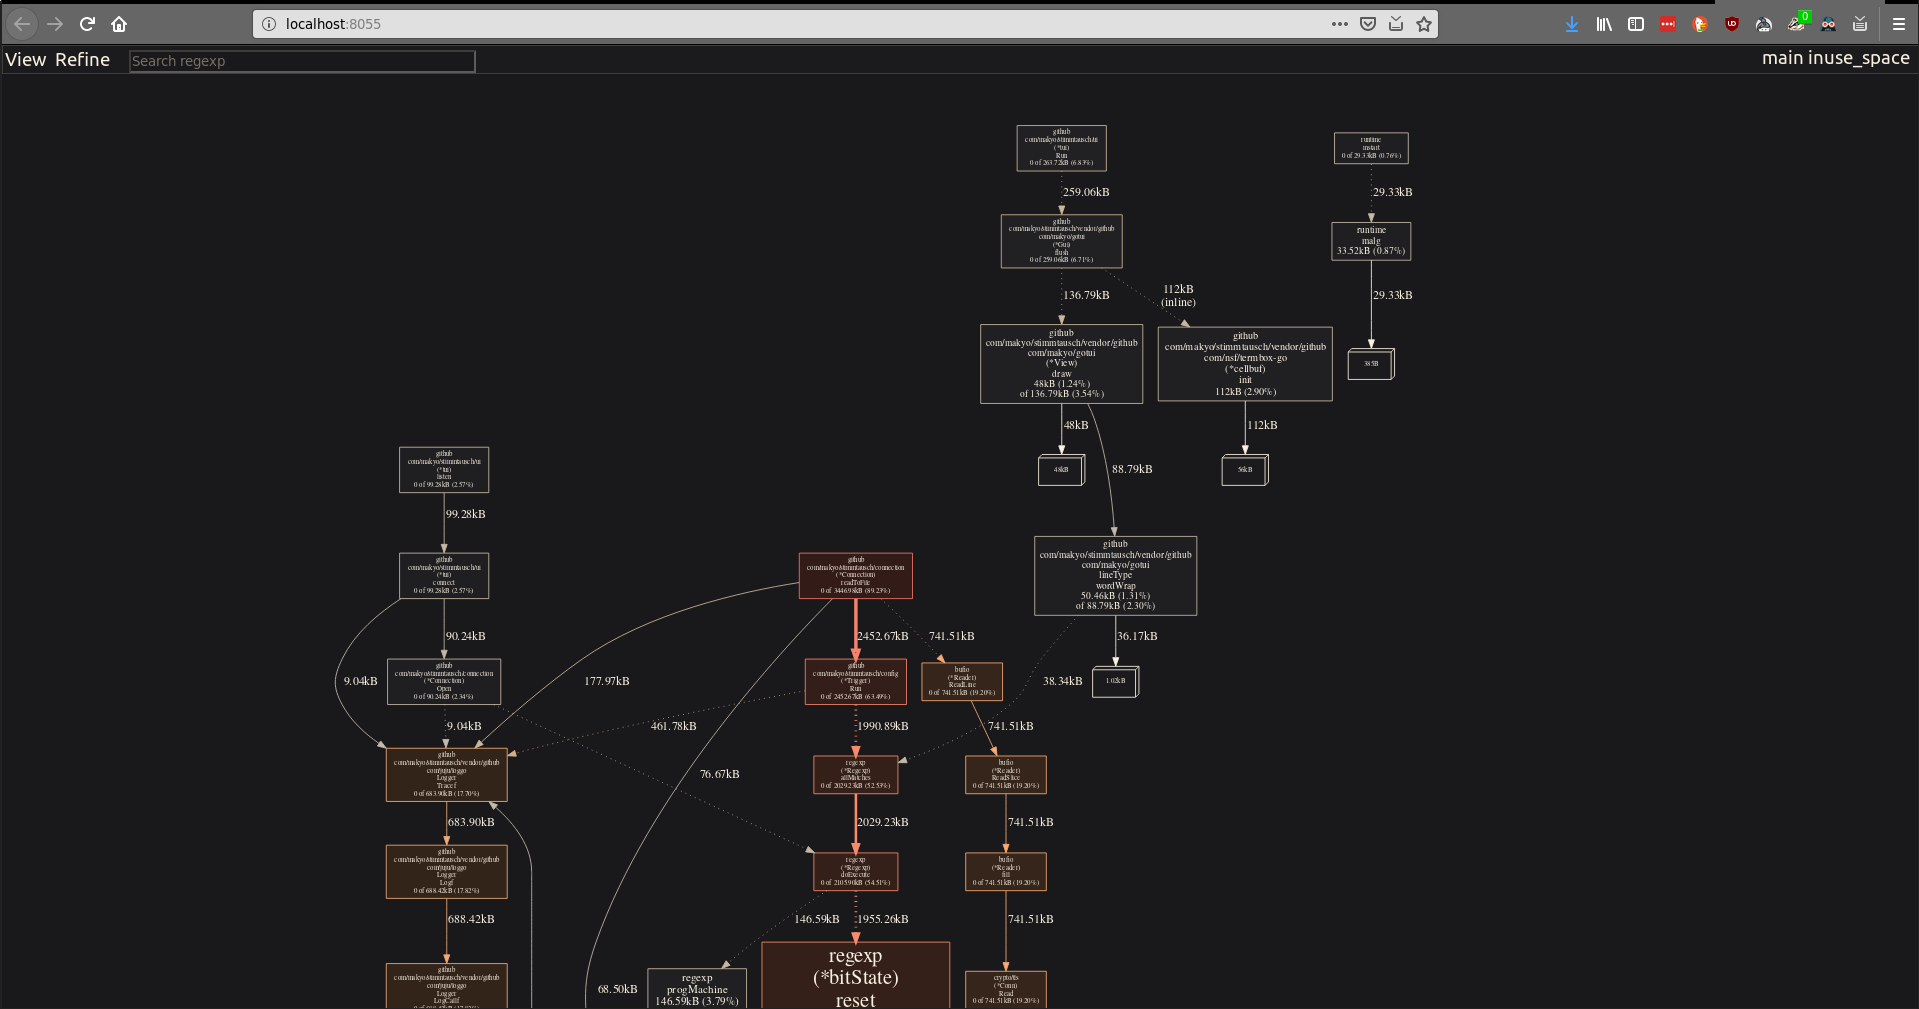
Another large number comes from gotui, which draws the terminal interface, taking up 740KB, however only 112KB of that belongs to termbox-go, which handles the actual drawing portion, as opposed to the views, which is what gotui is for. Of note is the 88KB spent on the wordWrap function that I added to gotui. I should probably rethink some of the logic there; it uses some regular expressions where it maybe could avoid them. Ah well.
Another suspected culprit with gotui is the output buffer. Rather than maintain a certain size, it contains all lines written to it, while the internal history buffer only contains 10,000 (or whatever you set it to in config). This could get big. An easy test for this is to redraw the output buffer with ^L, which clears it of all lines and then redraws from the history buffer (meaning it gets at most 10,000 lines). Let me do that now…nope. Huh!
Anyway, I’m just thinking out loud, at this point. I have a few more potential problem spots (e.g: reading from the FIFO), but I need to do some digging here!
Update!
Turns out it is the regular expressions being run (as opposed to compiled) that’s using memory; you can see here that it’s Trigger.Run() that’s calling the reset() mentioned above.